Portfolio treemap view
Background & Concept
Inspired by treemap views like the finviz treemap view of the S&P500, I decided I wanted this for my own ‘portfolio’. I didn’t really buy those but I think I’ve made a nice selection of stocks as a demonstration.
A nice free finance API
I’ve spent a good amount of time looking around for a free finance API, and I’ve come to the conclusion that there’s only one: Yahoo Finance. The others either provide historic data in bins of 15 minutes, have data on only some US exchanges, or are heavily rate-limited, or paid. If you surf to Yahoo Finance, you can find some of the smallest stocks like Moury Construct, a Belgian construction company that has ridiculously low trading volumes.
There are a few pip packages like yahoo-finance or yfinance, but one of them only offered historical data and the other straight up didn’t work for me. Eh, I only need one thing anyways: the most recent price a stock is traded at.
That, you can find on yahoo finance, in big bold letters, updated frequently. If you select that one in the developer console, you’ll see it leads to a minified json, where you can simply search for http to see which endpoints it uses.
Somewhere in a sea of minified js characters, you’ll find this beauty:
`https://query1.finance.yahoo.com/v7/finance/quote?&symbols=${this.symbolList.sort().join(",")}&fields=${this.fieldList.filter((e=>!r[e])).join(",")}`
which means you can pass symbols and fields in a request to that endpoint! Awesome!
After playing a little bit with those queries, and adjusting the user agent headers, I got returned a nice JSON, something like this:
{
  "quoteResponse": {
    "result": [
      {
        "language": "en-US",
        "region": "US",
        "quoteType": "EQUITY",
        "typeDisp": "Equity",
        "quoteSourceName": "Delayed Quote",
        "triggerable": false,
        "customPriceAlertConfidence": "LOW",
        "currency": "EUR",
        "marketState": "POSTPOST",
        "regularMarketChangePercent": 2.3255813,
        "regularMarketPrice": 264,
        "exchange": "BRU",
        "shortName": "MOURY CONSTRUCT",
        "longName": "Moury Construct SA",
        "messageBoardId": "finmb_2491914",
        "exchangeTimezoneName": "Europe/Brussels",
        "exchangeTimezoneShortName": "CEST",
        "gmtOffSetMilliseconds": 7200000,
        "market": "be_market",
        "esgPopulated": false,
        "bid": 0,
        "ask": 0,
        "bidSize": 0,
        "askSize": 0,
        "fullExchangeName": "Brussels",
        "financialCurrency": "EUR",
        "regularMarketOpen": 264,
        "averageDailyVolume3Month": 65,
        "averageDailyVolume10Day": 85,
        "fiftyTwoWeekLowChange": 14,
        "fiftyTwoWeekLowChangePercent": 0.056,
        "fiftyTwoWeekRange": "250.0 - 366.0",
        "fiftyTwoWeekHighChange": -102,
        "fiftyTwoWeekHighChangePercent": -0.27868852,
        "fiftyTwoWeekLow": 250,
        "fiftyTwoWeekHigh": 366,
        "earningsTimestamp": 1601031540,
        "earningsTimestampStart": 1601031540,
        "earningsTimestampEnd": 1601031540,
        "trailingAnnualDividendRate": 8.4,
        "trailingPE": 7.1312804,
        "trailingAnnualDividendYield": 0.03255814,
        "epsTrailingTwelveMonths": 37.02,
        "sharesOutstanding": 393821,
        "priceHint": 2,
        "regularMarketChange": 6,
        "regularMarketTime": 1665153043,
        "regularMarketDayHigh": 264,
        "regularMarketDayRange": "264.0 - 264.0",
        "regularMarketDayLow": 264,
        "regularMarketVolume": 77,
        "regularMarketPreviousClose": 258,
        "bookValue": 188.713,
        "fiftyDayAverage": 269.12,
        "fiftyDayAverageChange": -5.119995,
        "fiftyDayAverageChangePercent": -0.019024953,
        "twoHundredDayAverage": 304.55,
        "twoHundredDayAverageChange": -40.549988,
        "twoHundredDayAverageChangePercent": -0.13314722,
        "marketCap": 104774736,
        "priceToBook": 1.3989497,
        "sourceInterval": 15,
        "exchangeDataDelayedBy": 15,
        "tradeable": false,
        "cryptoTradeable": false,
        "firstTradeDateMilliseconds": 946972800000,
        "symbol": "MOUR.BR"
      }
    ],
    "error": null
  }
}
At least, you get a JSON like this when marketState is not CLOSED.
From data to treemap
I applied some of the same tricks as always: a little bit of python glue and a little bit of docker containers. The flow is the following: pycron regularly fetches data and dumps it into InfluxDB, which is then read out by grafana. Also, this docker-compose trick cost me a few hours: if you explicitly add a container to a network, it is no longer part of the default network! Let’s never forget that one. After that, it was a couple more hours of getting the hands dirty with Flux, InfluxDB’s query language. Here’s the one that calculates total portfolio value over time:
from(bucket: "portfolio")
  |> range(start: v.timeRangeStart, stop: v.timeRangeStop)
  |> filter(fn: (r) => r["_field"] == "USDValueInPortfolio")
  |> aggregateWindow(every: 1m, fn: last, createEmpty: false)
  |> group(columns: ["_time"])
  |> sum(column: "_value")
  |> group()
Took me a while to figure out you have to group by time before summing value across stock symbols. Finally, playing around with the treemap settings: size is based on value in portfolio, color is based on change w.r.t. previous close.
Screenshot
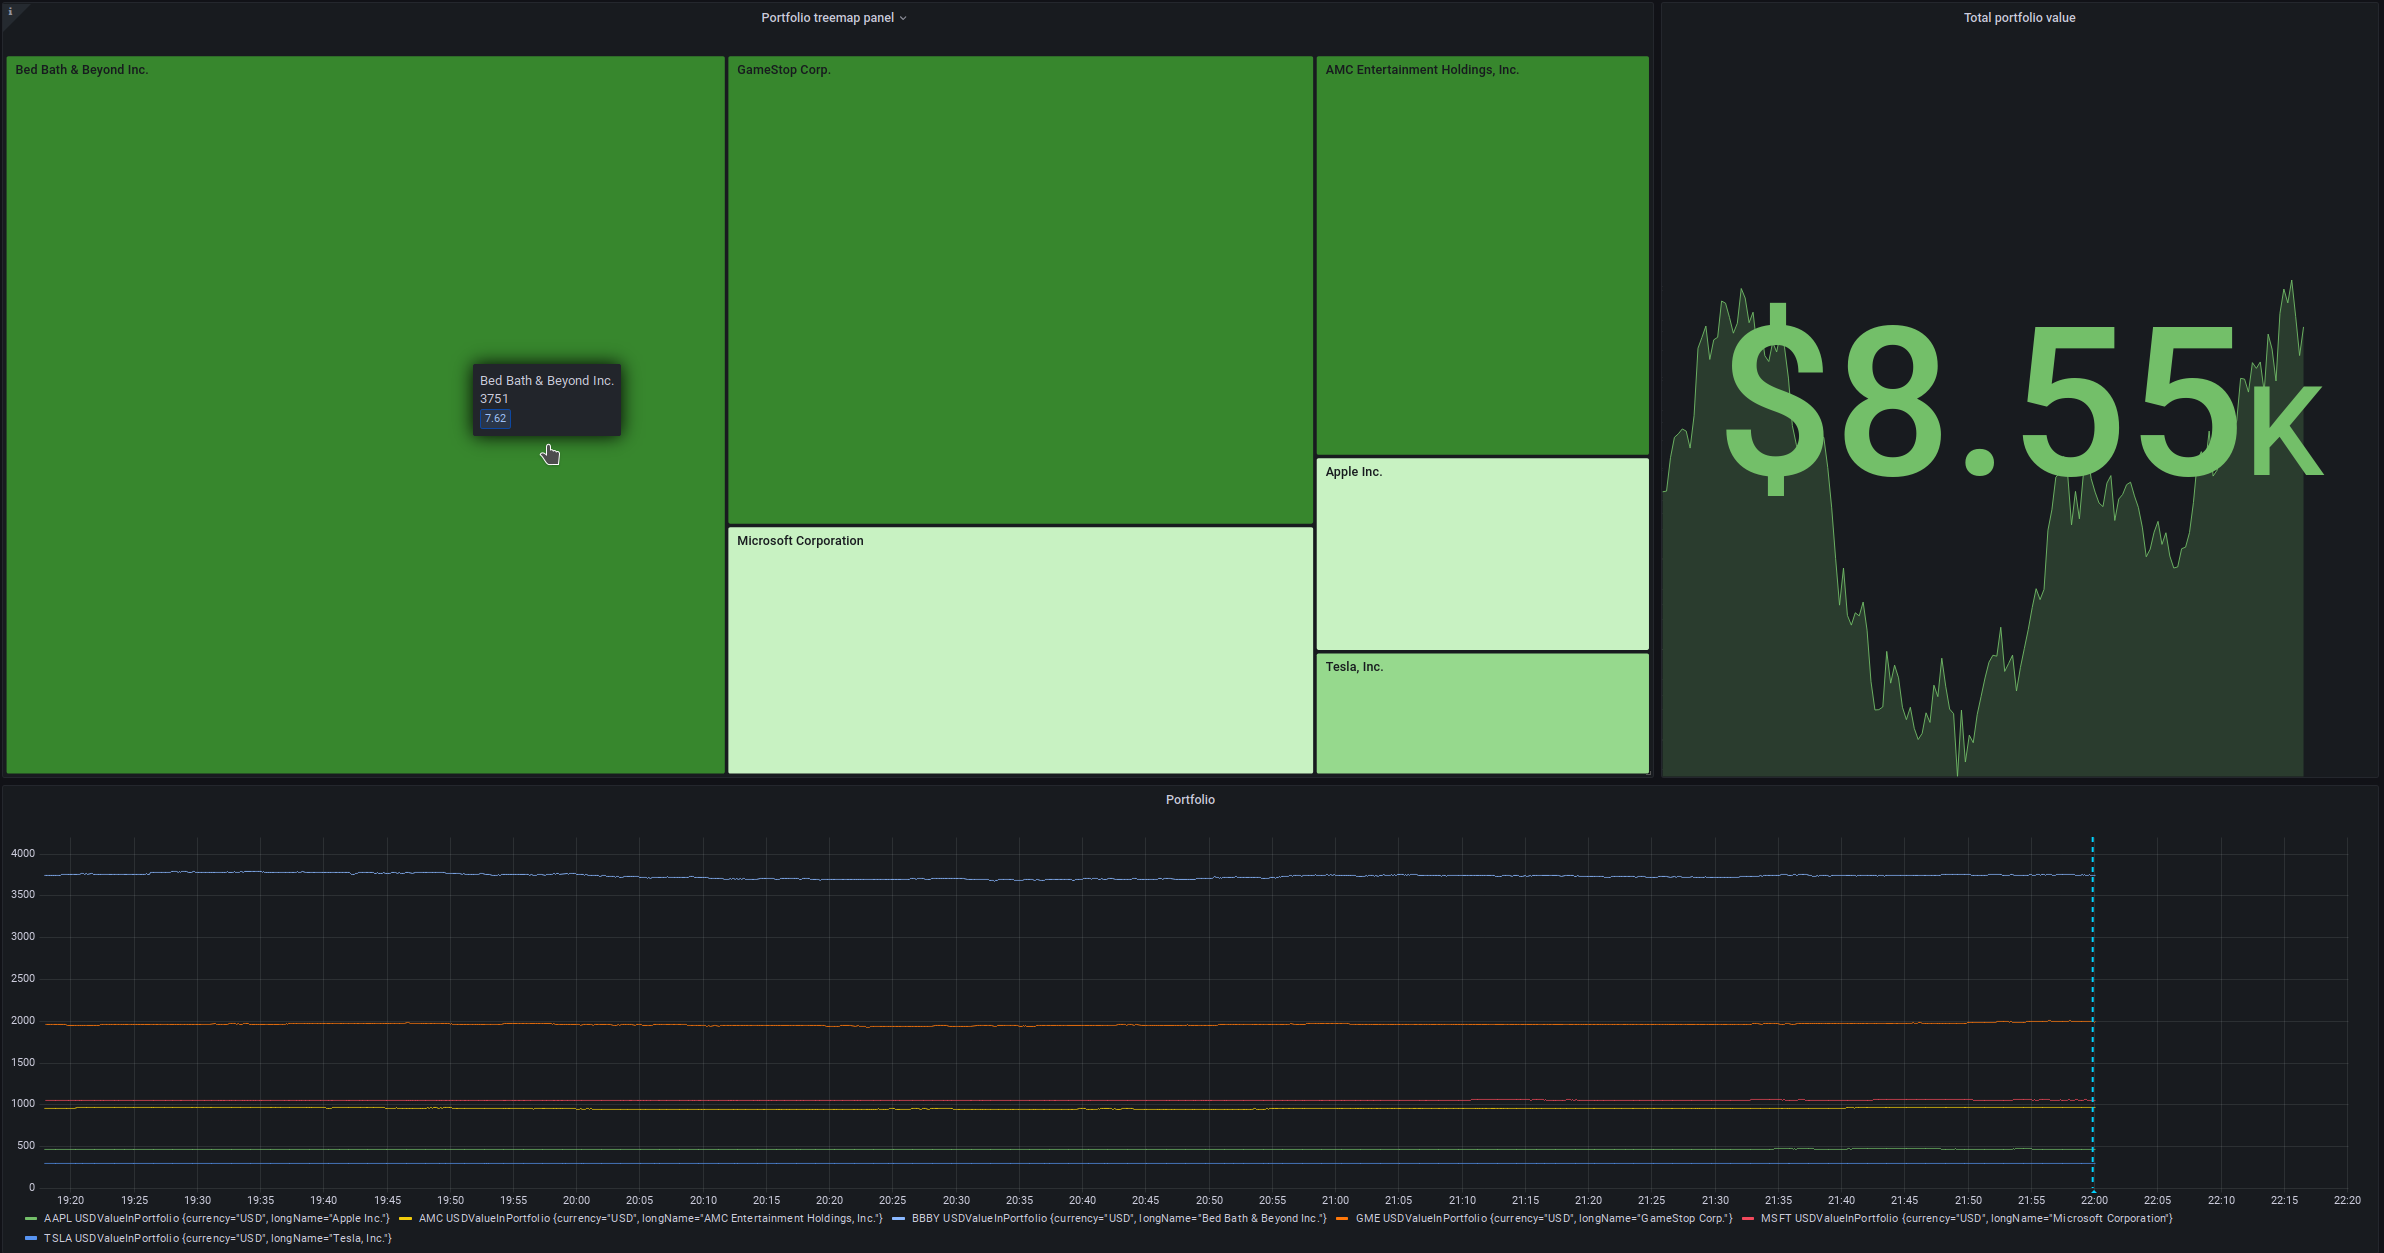
Grafana is super cool.
The legends at the bottom are clickable and filter out the stock you want to see the graph for.
The blue line represents an “annotation” where you can place a comment on a certain moment in time.
Conclusion
Yay, stocks in a treemap!